推荐 :如何比较两个或多个分布形态(附链接)
本文约7700字,建议阅读15分钟
本文从可视化绘图视角和统计检验的方法两种角度介绍了比较两个或多个数据分布形态的方法。

图片来自作者
from src.utils import *from src.dgp import dgp_rnd_assignmentdf = dgp_rnd_assignment().generate_data()df.head()

sns.boxplot(data=df, x='Group', y='Income');plt.title("Boxplot");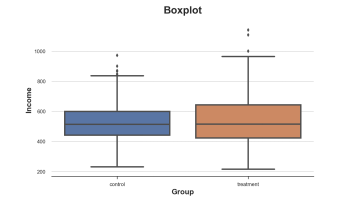
sns.histplot(data=df, x='Income', hue='Group', bins=50);plt.title("Histogram");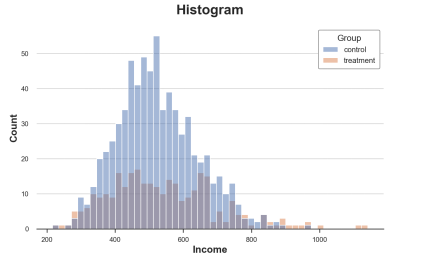
sns.histplot(data=df, x='Income', hue='Group', bins=50, stat='density', common_norm=False);plt.title("Density Histogram");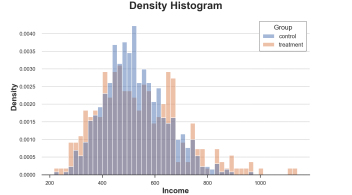
sns.kdeplot(x='Income', data=df, hue='Group', common_norm=False);plt.title("Kernel Density Function");
我们不需要做出任何武断的决策(例如,分组数量) 我们不需要做任何近似(例如:KDE),但是我们可以表征所有的数据点
sns.histplot(x='Income', data=df, hue='Group', bins=len(df), stat="density",element="step", fill=False, cumulative=True, common_norm=False);plt.title("Cumulative distribution function");
处理组和对照组的累积分布图,图片来自作者
两条线在0.5(y轴)附近交叉,意味着他们的中位数相似 在左侧橘色线在蓝色线上,而右侧则相反,意味着处理组分布的尾部更胖(极端值更多)
income = df['Income'].valuesincome_t = df.loc[df.Group=='treatment','Income'].valuesincome_c = df.loc[df.Group=='control','Income'].valuesdf_pct = pd.DataFrame()df_pct['q_treatment'] =np.percentile(income_t, range(100))df_pct['q_control'] =np.percentile(income_c, range(100))
plt.figure(figsize=(8, 8))plt.scatter(x='q_control', y='q_treatment',data=df_pct, label='Actual fit');sns.lineplot(x='q_control',y='q_control', data=df_pct, color='r', label='Line of perfectfit');plt.xlabel('Quantile of income, controlgroup')plt.ylabel('Quantile of income, treatmentgroup')plt.legend()plt.title("QQ plot");
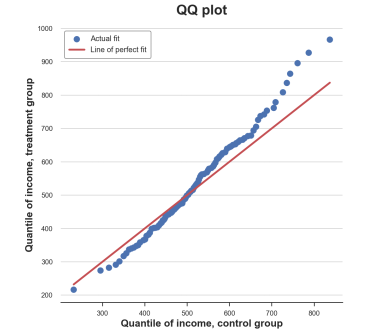

from scipy.stats import ttest_indstat, p_value = ttest_ind(income_c,income_t)print(f"t-test: statistic={stat:.4f}, p-value={p_value:.4f}")t-test:statistic=-1.5549, p-value=0.1203

from causalml.match import create_table_onedf['treatment'] =df['Group']=='treatment'create_table_one(df, 'treatment', ['Gender', 'Age','Income'])
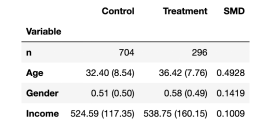
在前两列中,我们可以看到处理组和对照组不同变量的平均值,括号中是标准误差。在最后一列,SMD的值表明所有变量的标准化差异大于0.1,表明两组可能是不同的。
from scipy.stats import mannwhitneyustat, p_value = mannwhitneyu(income_t,income_c)print(f" Mann–Whitney U Test: statistic={stat:.4f}, p-value={p_value:.4f}")Mann–Whitney U Test: statistic=106371.5000, p-value=0.6012
sample_stat = np.mean(income_t) - np.mean(income_c)stats =np.zeros(1000)for k in range(1000): labels =np.random.permutation((df['Group'] == 'treatment').values) stats[k] =np.mean(income[labels]) - np.mean(income[labels==False])p_value =np.mean(stats > sample_stat)print(f"Permutation test: p-value={p_value:.4f}")Permutation test: p-value=0.0530
plt.hist(stats, label='Permutation Statistics', bins=30);plt.axvline(x=sample_stat,c='r', ls='--', label='Sample Statistic');plt.legend();plt.xlabel('Income differencebetween treatment and control group')plt.title('Permutation Test');

# Init dataframedf_bins = pd.DataFrame()# Generate bins from control group_,bins = pd.qcut(income_c, q=10, retbins=True)df_bins['bin'] = pd.cut(income_c,bins=bins).value_counts().index# Apply bins to bothgroupsdf_bins['income_c_observed'] = pd.cut(income_c,bins=bins).value_counts().valuesdf_bins['income_t_observed'] = pd.cut(income_t,bins=bins).value_counts().values# Compute expected frequency in the treatmentgroupdf_bins['income_t_expected'] = df_bins['income_c_observed'] /np.sum(df_bins['income_c_observed']) * np.sum(df_bins['income_t_observed'])df_bins
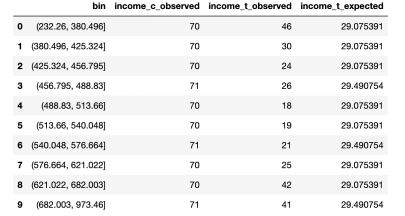

from scipy.stats import chisquarestat, p_value =chisquare(df_bins['income_t_observed'], df_bins['income_t_expected'])print(f"Chi-squared Test: statistic={stat:.4f}, p-value={p_value:.4f}")Chi-squared Test: statistic=32.1432, p-value=0.0002

df_ks = pd.DataFrame()df_ks['Income'] =np.sort(df['Income'].unique())df_ks['F_control'] = df_ks['Income'].apply(lambda x:np.mean(income_c<=x))df_ks['F_treatment'] = df_ks['Income'].apply(lambda x:np.mean(income_t<=x))df_ks.head()

k = np.argmax( np.abs(df_ks['F_control'] - df_ks['F_treatment']))ks_stat =np.abs(df_ks['F_treatment'][k] - df_ks['F_control'][k])
y = (df_ks['F_treatment'][k] + df_ks['F_control'][k])/2plt.plot('Income', 'F_control',data=df_ks, label='Control')plt.plot('Income', 'F_treatment', data=df_ks,label='Treatment')plt.errorbar(x=df_ks['Income'][k], y=y, yerr=ks_stat/2,color='k',capsize=5, mew=3, label=f"Test statistic:{ks_stat:.4f}")plt.legend(loc='center right');plt.title("Kolmogorov-Smirnov Test");
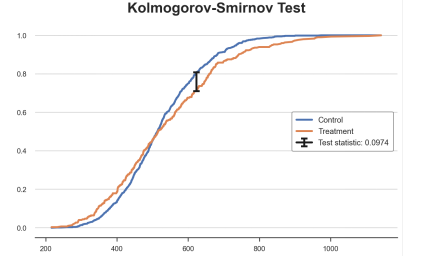
from scipy.stats import ksteststat, p_value = kstest(income_t, income_c)print(f"Kolmogorov-Smirnov Test: statistic={stat:.4f}, p-value={p_value:.4f}")Kolmogorov-Smirnov Test: statistic=0.0974, p-value=0.0355
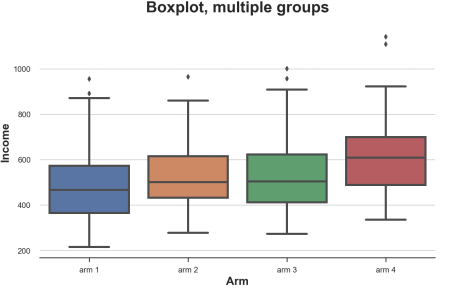
sns.boxplot(x='Arm', y='Income', data=df.sort_values('Arm'));plt.title("Boxplot,multiple groups");
sns.violinplot(x='Arm', y='Income', data=df.sort_values('Arm'));plt.title("ViolinPlot, multiple groups");

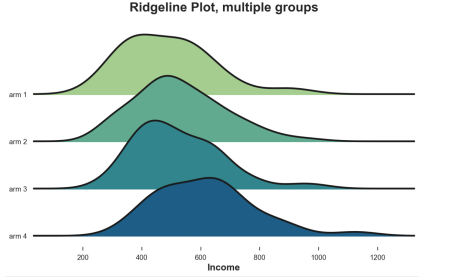
from joypy import joyplotjoyplot(df, by='Arm', column='Income',colormap=sns.color_palette("crest", as_cmap=True));plt.xlabel('Income');plt.title("Ridgeline Plot, multiple groups");

from scipy.stats import f_onewayincome_groups = [df.loc[df['Arm']==arm,'Income'].values for arm in df['Arm'].dropna().unique()]stat, p_value =f_oneway(*income_groups)print(f"F Test: statistic={stat:.4f}, p-value={p_value:.4f}")F Test: statistic=9.0911, p-value=0.0000
参考文献
[1] Student, The Probable Error of a Mean (1908), Biometrika.
[2] F. Wilcoxon, Individual Comparisons by Ranking Methods (1945), Biometrics Bulletin.
[3] B. L. Welch, The generalization of “Student’s” problem when several different population variances are involved (1947), Biometrika.
[4] H. B. Mann, D. R. Whitney, On a Test of Whether one of Two Random Variables is Stochastically Larger than the Other (1947), The Annals of Mathematical Statistics.
[5] E. Brunner, U. Munzen, The Nonparametric Behrens-Fisher Problem: Asymptotic Theory and a Small-Sample Approximation (2000), Biometrical Journal.
[6] A. N. Kolmogorov, Sulla determinazione empirica di una legge di distribuzione (1933), Giorn. Ist. Ital. Attuar..
[7] H. Cramér, On the composition of elementary errors (1928), Scandinavian Actuarial Journal.
[8] R. von Mises, Wahrscheinlichkeit statistik und wahrheit (1936), Bulletin of the American Mathematical Society.
[9] T. W. Anderson, D. A. Darling, Asymptotic Theory of Certain “Goodness of Fit” Criteria Based on Stochastic Processes (1953), The Annals of Mathematical Statistics.
译者简介:陈超,北京大学应用心理硕士在读。本科曾混迹于计算机专业,后又在心理学的道路上不懈求索。越来越发现数据分析和编程已然成为了两门必修的生存技能,因此在日常生活中尽一切努力更好地去接触和了解相关知识,但前路漫漫,我仍在路上。
END
转自:数据派THU;
版权声明:本号内容部分来自互联网,转载请注明原文链接和作者,如有侵权或出处有误请和我们联系。
合作请加QQ:365242293
数据分析(ID : ecshujufenxi )互联网科技与数据圈自己的微信,也是WeMedia自媒体联盟成员之一,WeMedia联盟覆盖5000万人群。

关注公众号:拾黑(shiheibook)了解更多
[广告]赞助链接:
四季很好,只要有你,文娱排行榜:https://www.yaopaiming.com/
让资讯触达的更精准有趣:https://www.0xu.cn/
 关注网络尖刀微信公众号
随时掌握互联网精彩
- 1 习近平同马克龙交流互动的经典瞬间 7904551
- 2 黑龙江水库冰面下现13匹冰冻马 7807898
- 3 微信表情包戒烟再度翻红 7712599
- 4 2025你的消费习惯“更新”了吗 7618258
- 5 三星堆与秦始皇帝陵竟有联系 7521328
- 6 为啥今年流感如此厉害 7423612
- 7 劲酒如何成了年轻女性的神仙水 7331089
- 8 一身塑料过冬?聚酯纤维真是塑料瓶吗 7232017
- 9 15岁高中生网购日军侵华史料捐出 7140529
- 10 中疾控流感防治七问七答 7045514

 数据分析
数据分析


