推荐 :你要的用户画像实践来了!
有读者联系我希望做一期和用户画像有关的文章,那么这一期我们就来简单的聊一聊用户画像...
知乎原文链接:https://zhuanlan.zhihu.com/p/339848708
0.身边的用户画像
首先我们来感性的认识一下用户画像
用户画像的核心是为用户打标签,即——将用户的每个具体信息抽象成标签,利用这些标签将用户形象具体化,从而为用户提供有针对性的服务。
我们身边就有用户画像应用比较好的例子
比如我前几天在某网站上看到一个女生相亲的择偶标准,印象比较深刻

如果我们是某相亲网站的工作人员,需要给这个女生进行男嘉宾的匹配,那么她理想的男嘉宾就是一个群体,通过一个个的标签来描述这个群体。
男性,未婚,年龄33-28岁,身高176-188,皮肤白体型偏瘦,年收入在12万元以上,在武汉生活并且购房,拥有本科以及上的学历,家中独子没有兄弟姐妹,不喜欢打牌。
1.用户画像体系相关概念
如何一句话说清楚什么是用户画像?
用户画像是通过分析用户的基础信息、特征偏好、社会属性等各维度的数据,刻画出用户的信息全貌,从中挖掘用户价值,从而提供个性化推荐、精准营销等服务。
1.1标签类型
我们一般将用户标签分为3类
统计类标签
这类标签是最为基础也最为常见的标签类型,例如:对于某个用户来说,其姓名、性别、年龄、地市、活跃时长等,这类数据可以从用户注册数据、用户消费数据中得出,该类数据构成了用户画像的基础。
规则类标签
基于用户的行为以及规则,在实际开发画像的过程中,由于运营人员对业务更为熟悉,而数据人员对数据的结构、分布、特征更为熟悉,因此规则类标签的规则由运营人员和数据人员共同协商确定
学习挖掘类标签
通过机器学习挖掘产生,根据用户的行为和规则进行预测和判断。比如某个用户检查购买卫生巾,我们可以通过这个行为来推出用户性别为女性
1.2画像价值
在用户量大业务复杂的公司,都会花很高的成本构建用户画像体系,在各个业务线上采集数据做分析,不断深入的了解用户才能提供更加精准的服务和多样化的运营策略。

用户引流
通过现有用户的画像分析,在相关DMP广告平台做投放,重点推荐其平台上具有相关类似标签的用户,为产品做用户引流,这里用的是相似用户快速扩量的概念。
新用户冷启动
快速分析新注册用户可能偏向的属性和兴趣偏好,实现服务快速精准推荐,例如用户注册地所在区域,可以通过该区域用户的通用标签推测该新用户的特征。
精准或个性化服务
这里就是根据丰富的用户画像分析,理解用户并提供精准服务或个性化服务。提供好的服务自然能做到用户的深度沉淀。
多场景识别
这里场景相对偏复杂,通过一个案例描述,例如在某个平台用手机号A注册,之后该手机号A丢失,换用手机号B之后,通过相关行为去理解用户是否手机号A的用户,也可以根据同个手机序列识别不同用户或者多个手机序列识别相同用户。
沉默用户唤醒
基于精细化的标签和多个场景数据,对用户的沉默程度做快速识别,基于画像分析制定运营策略进行激活召回减少用户流失。
2.用户画像实践项目
你是某电商公司的数据分析师,你的运营同事找到你,最近平台某家电类目的订单数量,浏览量有所下降,平台想做一些促销活动,给用户发优惠劵,希望你能对本次活动提出一些建议
促销活动需要哪几个部分的信息呢?
促销活动的受众群体 促销活动的上线时间 促销活动所覆盖的产品 ...
确定问题后,我们从用户的基本属性,行为属性以及偏好属性入手
2.1从数据库中提取数据
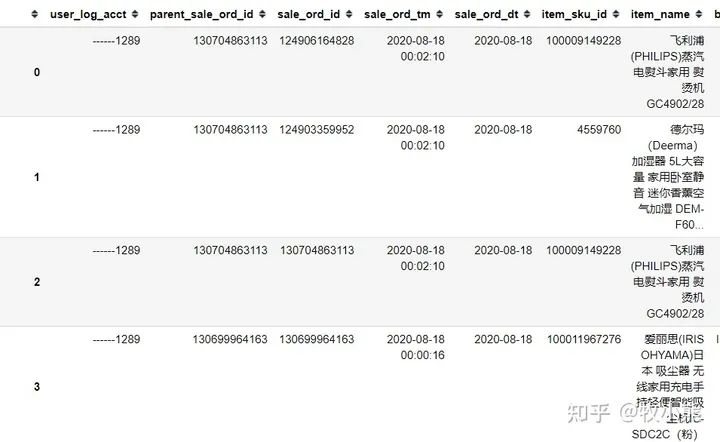
数据来源某电商平台2020年8月12日-2020年8月19日某家电类目脱敏订单数据
Datawhale公众号后台回复 电商数据 可获取数据。
data.head()
2.2用户性别和年龄分布
labels = ['男','女']
values = [male_user, female_user]
trace = [go.Pie(labels=labels, values=values)]
layout = go.Layout(
    title = dict(text='用户的性别分布',x=0.5)
)
fig = go.Figure(data = trace, layout = layout)
fig
x = ['18岁以下', '18~25岁',  '25~35岁', '35~45岁', '45~55岁', '55岁以上']
y = user_age_df['user_age_count']
trace = go.Bar(
    x = x,
    y = y,
    text=y,
    textposition='outside')
layout = go.Layout(
    title = dict(text='用户年龄分布',x=0.5),

)
fig = go.Figure(data=trace,layout=layout)
fig
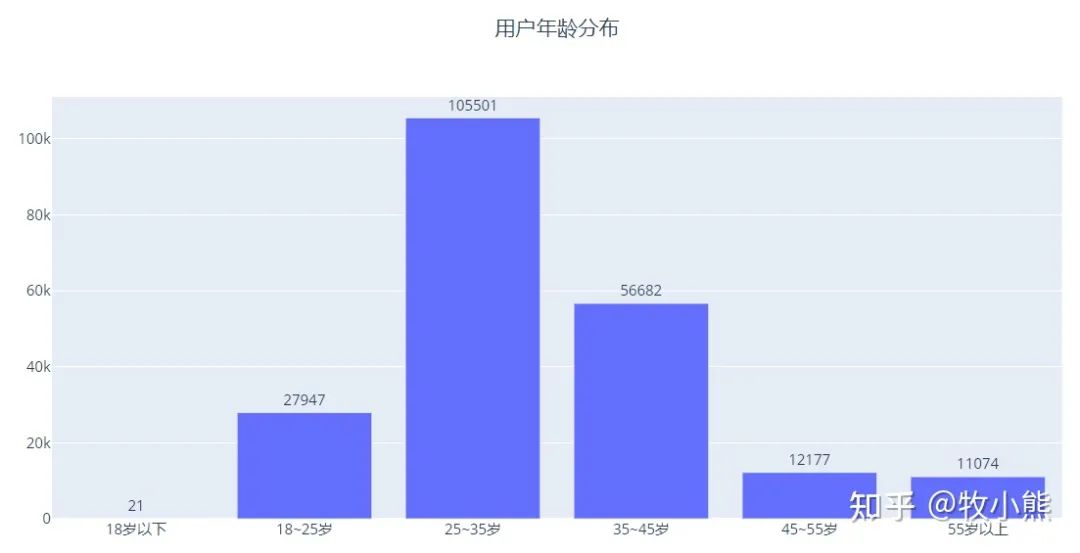
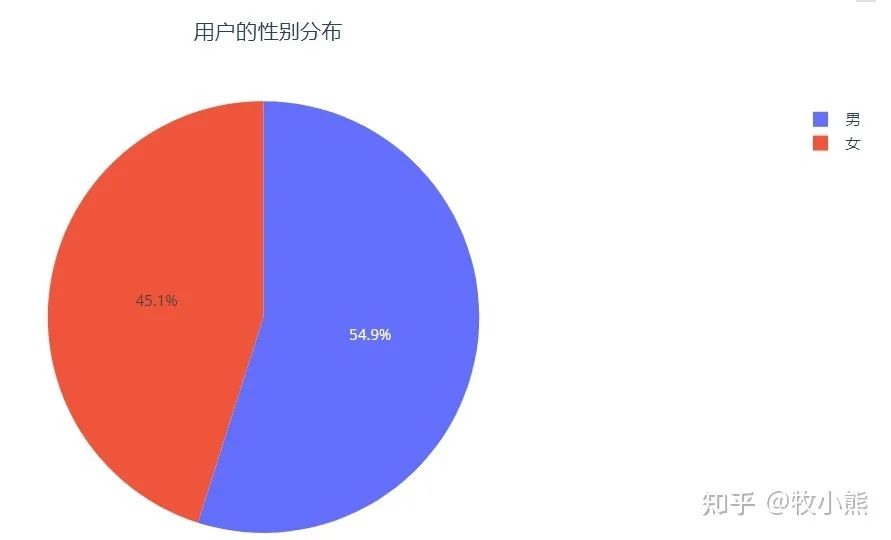
从数据来看,用户消费没有明显的性别偏好,男性用户稍微多一点,用户的年龄集中在25-35岁之间,25岁以下以及45岁以上的用户数较少。
25岁以下的用户多为在校学生,对于家电类目的购买需求低
45岁以上的用户多为中年人员,家电类目需求低,同时手机网购的比例低
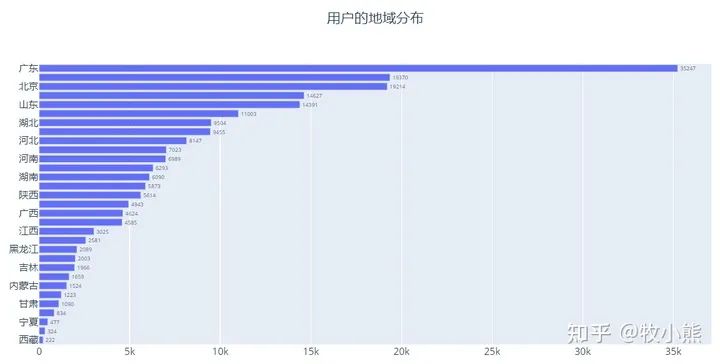
2.3用户地域分布
y = user_region_df['province_name'][::-1] # 切片方法,让列表反向。两个冒号分隔为{起始位置:终止位置:步长}
x = user_region_df['region_count'][::-1] # 其中步长为正,从左往右取,步长为负,从右往左取
trace = go.Bar(
    x = x,
    y = y,
    text=x,
    textposition='outside',
    orientation = 'h')
layout = go.Layout(
    title = dict(text='用户的地域分布',x=0.5)

)
fig = go.Figure(data=trace,layout=layout)
fig
y = user_city_df['ulp_addr_city'][::-1]
x = user_city_df['city_count'][::-1]
trace = go.Bar(
    x = x,
    y = y,
    text=x,
    textposition='outside',
    orientation = 'h')
layout = go.Layout(
    title = dict(text='用户的城市分布',x=0.5)

)
fig = go.Figure(data=trace,layout=layout)
fig
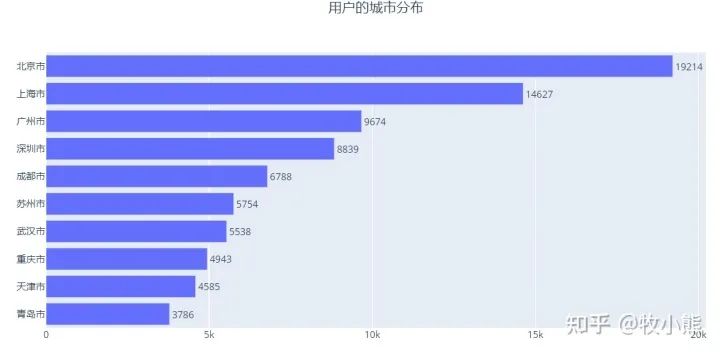
用户在城市分布上具有一定的集中性,大多集中在一线和新一线城市,因为一线城市对年轻人有很强的吸引力,因此城市分布和用户的年龄分布也相符合
2.4用户的婚育状况
labels = ['已婚', '未婚']
values = [married_user, unmarried_user]
trace = [go.Pie(labels=labels, values=values)]
layout = go.Layout(
    title = dict(text='用户的性别分布',x=0.5)
)
fig = go.Figure(data = trace, layout = layout)
fig
labels = ['高', '较高', '较低', '低']
values = [very_high, high, low, very_low]
trace = [go.Pie(labels=labels, values=values)]
layout = go.Layout(
    title = dict(text='用户的小孩情况',x=0.5)
)
fig = go.Figure(data = trace, layout = layout)
fig
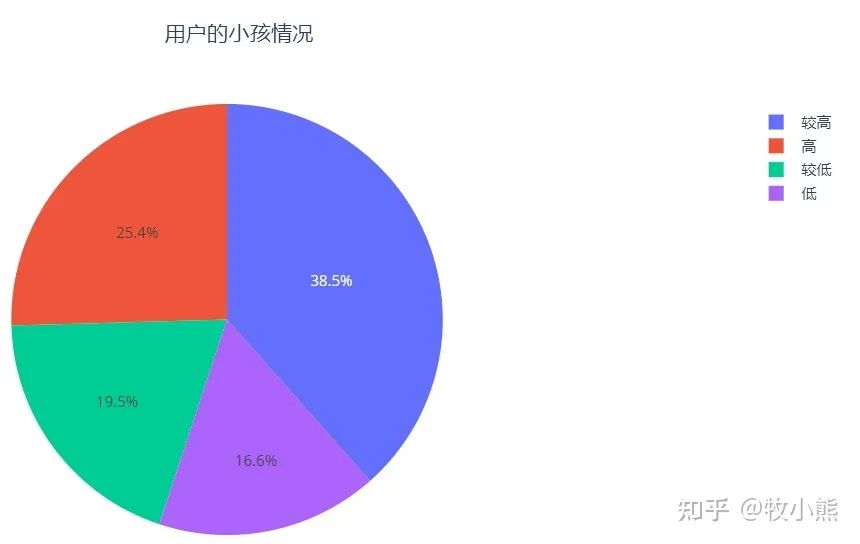
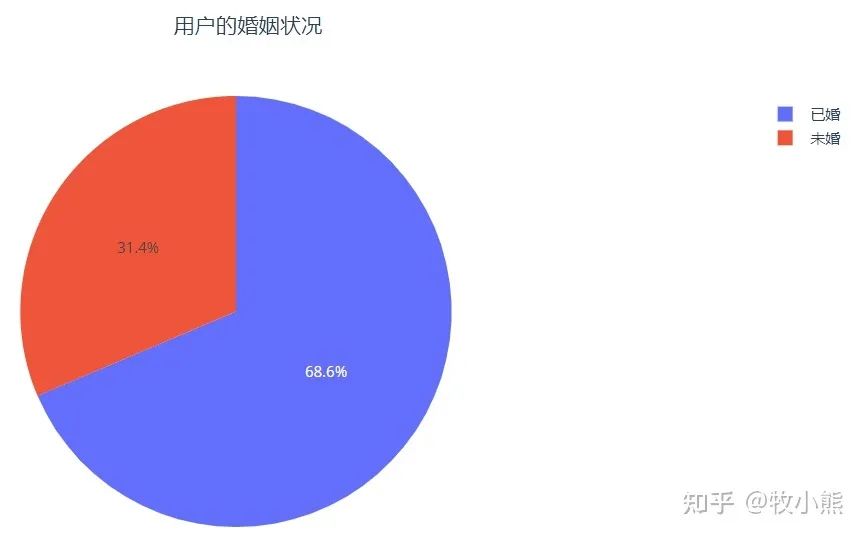
从图中的数据来看,近70%的小家电用户都是已婚,超过60%的用户有小孩的可能性高
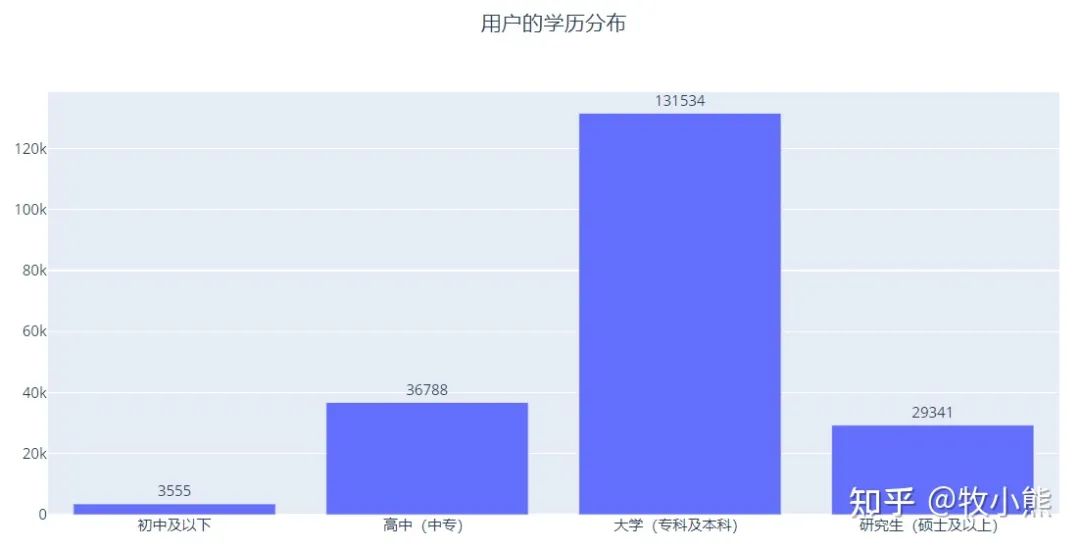
2.5用户的学历和职业分布
y = user_edu_df['edu']
x = x = ['初中及以下', '高中(中专)', '大学(专科及本科)', '研究生(硕士及以上)']
trace = go.Bar(
    x = x,
    y = y,
    text=y,
    textposition='outside')
layout = go.Layout(
    title = dict(text='用户的学历分布',x=0.5)

)
fig = go.Figure(data=trace,layout=layout)
fig
x = ['金融从业者', '医务人员', '公务员/事业单位', '白领/一般职员', '工人/服务业人员', '教师', '互联网从业人员', '学生']
y = user_profession_df['profession']
trace = go.Bar(
    x = x,
    y = y,
    text=y,
    textposition='outside')
layout = go.Layout(
    title = dict(text='用户的学历分布',x=0.5)

)
fig = go.Figure(data=trace,layout=layout)
fig
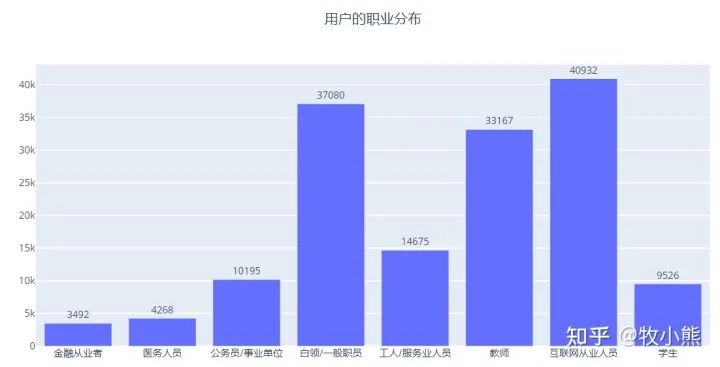
通过用户的基础属性的研判来看,小家电的典型用户为:
男性,年龄在28-30岁左右,已婚且有孩子
他在一线城市居中,本科学历,在一家互联网公司任职,有比较稳定的收入
因为还刚进入婚姻,因此有一定的生活品质追求,同时比较关注家庭生活
因此,我们给运营同事的建议是,文案不用过于个性,促销的商品要重点突出家庭品质生活属性,同时强调家电的健康与安全
2.6用户购买商品分布
y = user_order_cate_df['item_third_cate_name'][::-1]
x = user_order_cate_df['cate_count'][::-1]
trace = go.Bar(
    x = x,
    y = y,
    text=x,
    textposition='outside',
    orientation = 'h')
layout = go.Layout(
    title = dict(text='用户购买商品分布',x=0.5)

)
fig = go.Figure(data=trace,layout=layout)
fig

用户购买商品的类目是用户的行为数据,从图中的数据来看,最受欢迎的电器是电风扇,考虑到这个数据采集的时间是8月12日,用户购买电风扇的需求得到了释放,在即将进入秋天,因此应该对其它商品 比如净水器,加湿器等商品进行促销
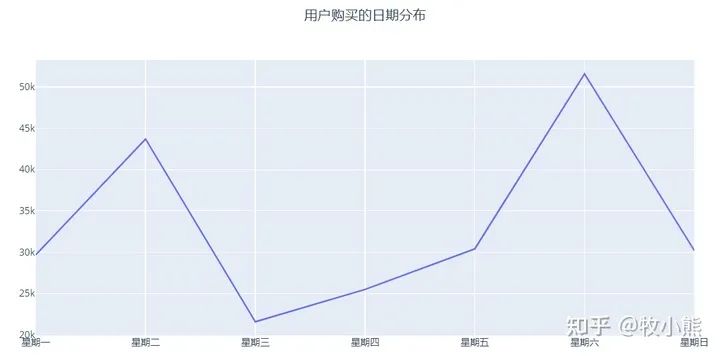
x = ['星期一', '星期二', '星期三', '星期四', '星期五', '星期六', '星期日']
y = user_order_week_df_2['week_count']
trace = go.Scatter(
    x = x,
    y = y,
    mode = 'lines', # 折线图
    line = dict(
        width = 2
    ) )
layout = go.Layout(
    title = dict(text='用户购买的日期分布',x=0.5))


fig = go.Figure(data=trace,layout=layout)
fig
x = [str(x) for x in range(0, 24)]
y = user_order_hms_df['hms_count']
trace = go.Scatter(
    x = x,
    y = y,
    mode = 'lines', # 折线图
    line = dict(
        width = 2
    ) )
layout = go.Layout(
    title = dict(text='用户购买的时间分布',x=0.5),
    xaxis=dict(
        tickmode='linear'))
fig = go.Figure(data=trace,layout=layout)
fig
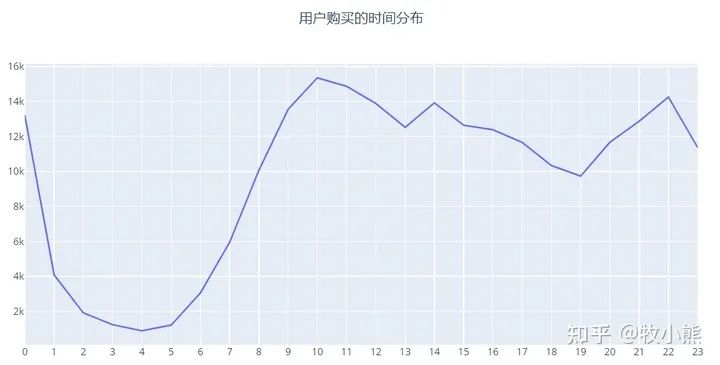
从日期和时间维度来看,订单成交的高峰在周二和周六,从每天的时间来看,早上10点-11点,晚上20点-22点有较大的成交量。
推测形成的原因,每周的周二和周六用户更喜欢访问电商网站,并在早上10点左右下单,或者晚上10准备上床休息时下单。
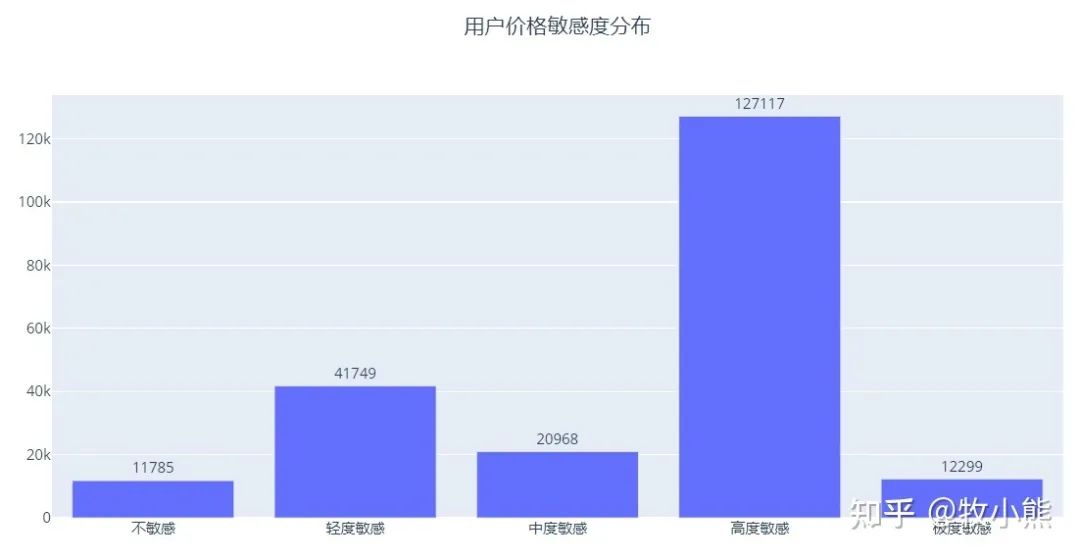
2.7用户敏感度分析
x = ['不敏感', '轻度敏感', '中度敏感', '高度敏感', '极度敏感']
y = user_order_sens_promotion_df['sens_promotion_count']
trace = go.Bar(
    x = x,
    y = y,
    text=y,
    textposition='outside')
layout = go.Layout(
    title = dict(text='用户价格敏感度分布',x=0.5)

)
fig = go.Figure(data=trace,layout=layout)
fig
x = ['不敏感', '轻度敏感', '中度敏感', '高度敏感', '极度敏感']
y = user_order_sens_comment_df['sens_comment_count']
trace = go.Bar(
    x = x,
    y = y,
    text=y,
    textposition='outside')
layout = go.Layout(
    title = dict(text='用户频率敏感度分布',x=0.5)

)
fig = go.Figure(data=trace,layout=layout)
fig
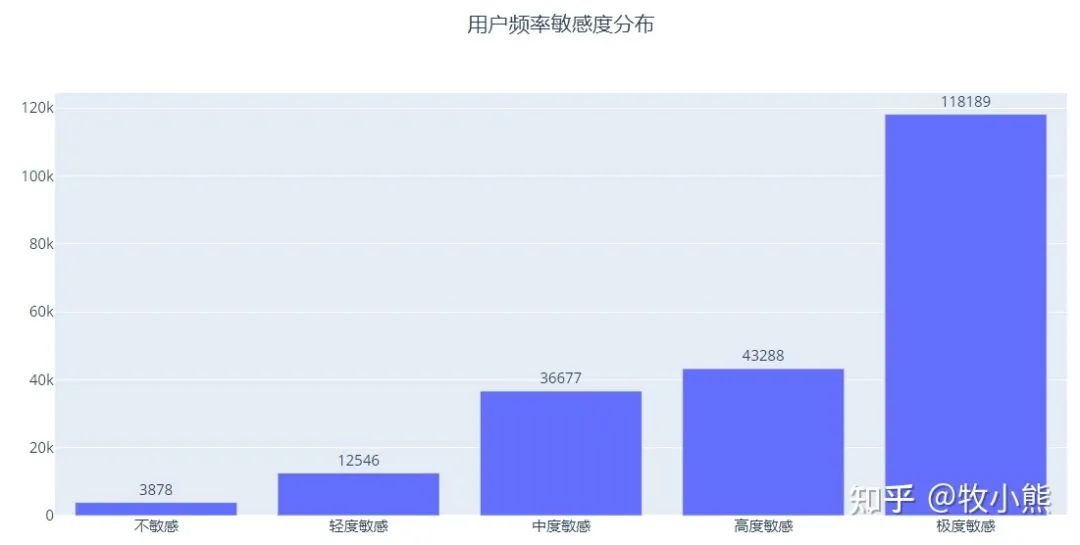
通过用户敏感度分析来看,用户对价格较为敏感,同时对评论极度敏感,因此促销活动的商品需要选择有较好口碑的商品,才能提升活动的转化率
因此我们给运营同事的建议是:
促销活动的文案最好采用中性风格,促销的商品要重点突出家庭品质生活属性,同时强调家电的健康与安全 促销的商品以夏末秋初需求旺盛的商品,如净水器,饮水机,加湿器等产品入手 促销广告投放的时间,最好选择在每周的周二和周六这2个时间段,同时在早上9点和晚上9点提高广告的频率 促销的商品需要选择评论口碑较好的产品,可以在广告中对商品的口碑进行介绍
3.实践思考
运营的同事听了你的建议,决定找了一些口碑较好的净水器进行定向促销,但是由于活动资金的限制,只能选择几个特定型号的产品进行推广,因此同事希望你在产品的品牌和价格的选择上给出一些建议。
转自:Datawhale ;作者:牧小熊,华中农业大学,Datawhale原创作者;
商务合作|约稿 请加qq:365242293
更多相关知识请回复:“ 月光宝盒 ”;
数据分析(ID : ecshujufenxi )互联网科技与数据圈自己的微信,也是WeMedia自媒体联盟成员之一,WeMedia联盟覆盖5000万人群。
关注公众号:拾黑(shiheibook)了解更多
[广告]赞助链接:
四季很好,只要有你,文娱排行榜:https://www.yaopaiming.com/
让资讯触达的更精准有趣:https://www.0xu.cn/
 关注网络尖刀微信公众号
随时掌握互联网精彩
- 1 美丽中国铺展新画卷 7904840
- 2 李在明女翻译因高颜值走红 7808192
- 3 金饰价格跌至1253元 7711933
- 4 中国能源领域迎来多个新突破 7618072
- 5 被大陆通缉的台军麻烦大了 7521088
- 6 老夫妇扎堆领结婚证 民政局回应 7425993
- 7 护网:WannaCry勒索风暴的警示与防范 7330420
- 8 杨振宁留给大家的8个字 7238784
- 9 杨振宁谈曾放弃中国籍:是痛苦的决定 7142711
- 10 国民党今日选出新主席 7044972


 数据分析
数据分析


