推荐 :一文读懂模型的可解释性(附代码&链接)
本文长度为10000字,建议阅读10+分钟
对于信任和管理我们的人工智能“合作伙伴”,可解释AI则至关重要。
目录
1.1 可解释的重要性
1.2 可解释性的范围
1.2.1. 算法透明度(Algorithm Transparency)
1.2.2 全局可解释(Global Interpretability)
1.2.3 局部可解释(Local Interpretability)
2.1 Permutation Feature Importance
2.1.1 实例
2.2 Partial Dependency Plots
2.2.1 优缺点
2.2.2 实例
2.3 ICE(Individual Conditional Expectation)
2.4 LIME
2.4.1 可解释性和性能的平衡
2.4.2 LIME分析步骤
2.4.3 优缺点
2.4.4 实例
2.5 SHAP(SHapley Additive exPlanation)
2.5.1 shapley值
2.5.2 优缺点
2.5.3 实例
3.1 Interpret
3.1.1 GAMS
3.2 非事实解释(Counterfactual Explanations)
一、可解释的特性
1.1 可解释的重要性
模型改进
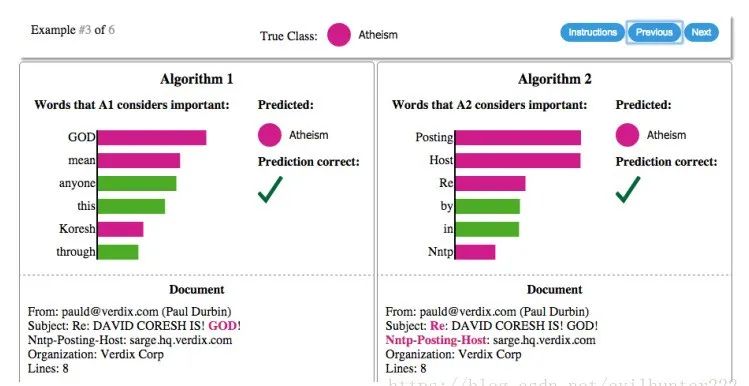
模型的可信和透明度
识别和防止偏差
1.2 可解释性的范围
1.2.1. 算法透明度(Algorithm Transparency)
How does the algorithm create the model?

1.2.2 全局可解释(Global Interpretability)
1.2.3 局部可解释(Local Interpretability)
Why did the model make a certain prediction for an/a group of instance?
二、与模型无关的方法
2.1 Permutation Feature Importance
2.1.1 实例
数据的下载链接:
https://www.kaggle.com/uciml/adult-census-income#adult.csv
feature_names = ["Age", "Workclass", "fnlwgt", "Education", "Education-Num", "Marital Status","Occupation", "Relationship", "Race", "Sex", "Capital Gain", "Capital Loss","Hours per week", "Country"]data = np.genfromtxt('adult.data', delimiter=', ', dtype=str)data = pd.DataFrame(data, columns=feature_names+['label'])
labels = data.iloc[:,14]le= LabelEncoder()le.fit(labels)labels = le.transform(labels)class_names = le.classes_# data = data[:,:-1]categorical_features = [1,3,5, 6,7,8,9,13]categorical_names = {}for feature in categorical_features:le = LabelEncoder()le.fit(data.iloc[:, feature])data.iloc[:, feature] = le.transform(data.iloc[:, feature])categorical_names[feature] = le.classes_data[feature_names] = data[feature_names].astype(float)encoder = OneHotEncoder(categorical_features=categorical_features)
np.random.seed(1)train, test, labels_train, labels_test = sklearn.model_selection.train_test_split(data[feature_names], labels, train_size=0.80)# encoder.fit(data)# encoded_train = encoder.transform(train)# encoded_test = encoder.transform(test)gbtree = xgb.XGBClassifier(n_estimators=2000, max_depth=4, learning_rate=0.05, n_jobs=8)gbtree.fit(train, labels_train,eval_set=[(test, labels_test)], eval_metric='auc', verbose=100, early_stopping_rounds=100)

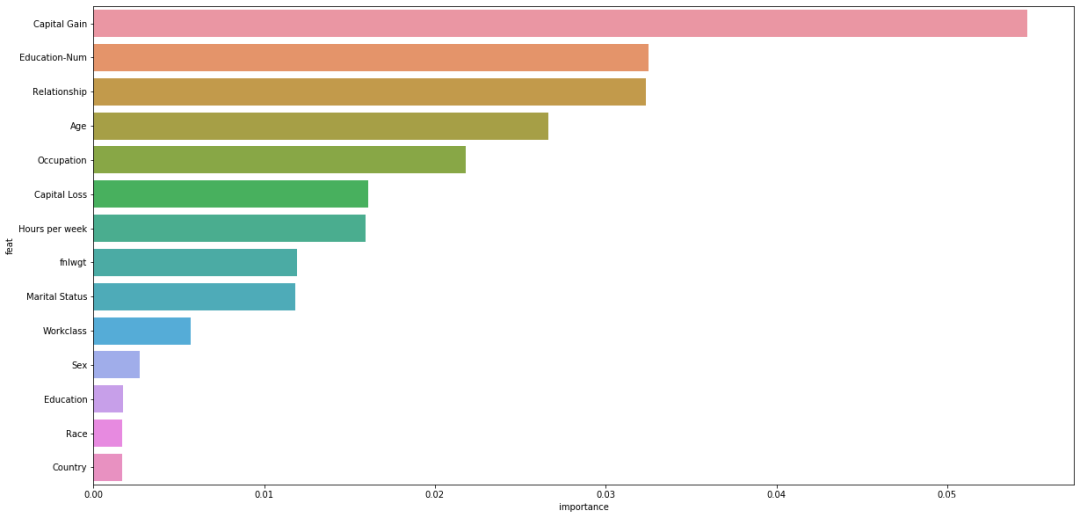
from sklearn.inspection import permutation_importanceresult = permutation_importance(clf, train_x, train_y, n_repeats=10,random_state=42)featImp = pd.DataFrame()featImp['feat'] = feature_namesfeatImp['importance'] = result.importances_meanfeatImp = featImp.sort_values('importance',ascending = False)plt.figure(figsize=[20,10])sns.barplot(x = 'importance', y = 'feat',data = featImp[:20],orient='h')plt.show
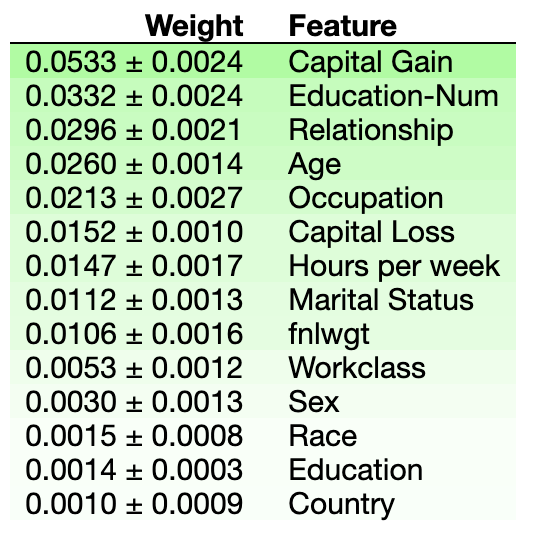
import eli5from eli5.sklearn import PermutationImportanceperm = PermutationImportance(clf, n_iter=10)perm.fit(train_x, train_y)eli5.show_weights(perm, feature_names=train_x.columns.tolist())
2.2 Partial Dependency Plots
:PDP所需要绘制的特征; :模型中使用的其他特征;
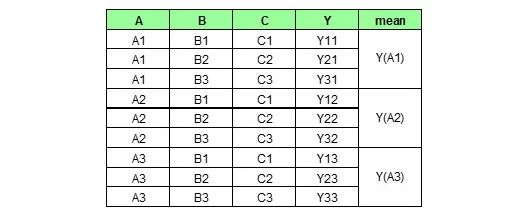
训练一个机器学习模型(假设特征是,是目标变量,是最重要的特征); 我们想探索探索和的直接关系,的取值是; 用代替列,利用训练的模型对这些数据进行预测,求所有样本的预测的平均值; 对重复步骤3,即遍历特征的所有不同值; PDP的X轴为特征的各个值,而Y轴是对应不同值的平均预测平均值。


2.2.1 优缺点
计算直观:在某个特征取特定值时,对预测取平均值; 解释清晰:PDP展示了随着特征值的改变,预测值的改变情况; 容易实现。
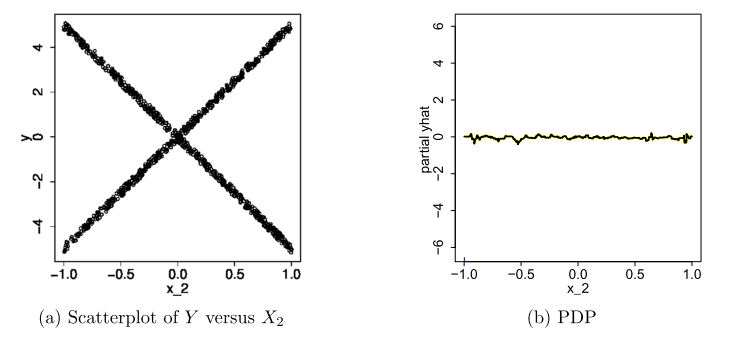
最多考虑两个特征:空间维度的限制,超过三维我们无法想象。如果不用图像显示特征分布,很难解释规律性; 独立性假设:需要满足特征两两独立,如果特征之间存在相关性,所求结果不合理; 异步效应可能被隐藏:特征变化对整个数据集带来的影响,也许一半数据集预测增加,一半介绍,取平均将是不变。
2.2.2 实例
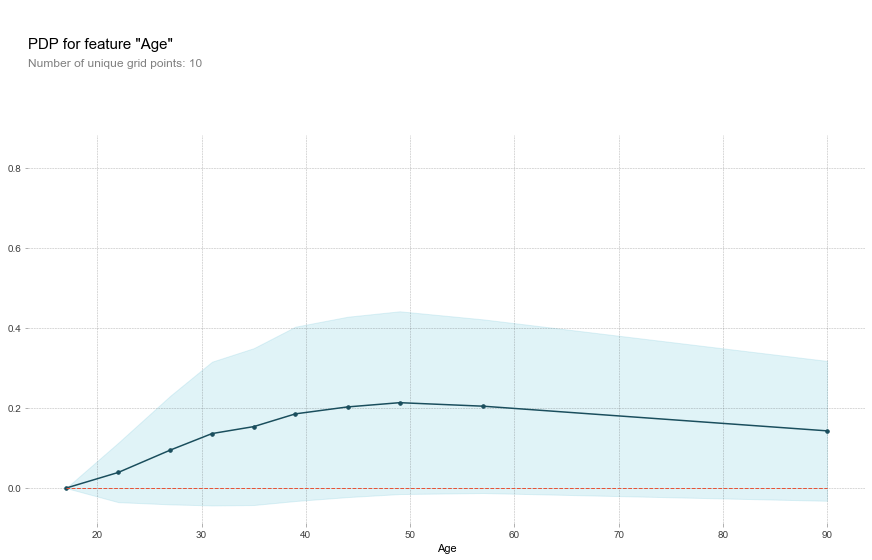
pdp_fare = pdp.pdp_isolate(model=gbtree, dataset=data, model_features=feature_names, feature='Age')fig, axes = pdp.pdp_plot(pdp_fare, 'Age')
fig, axes, summary_df = info_plots.target_plot(df=data, feature='Age', feature_name='age', target='label', show_percentile=True)
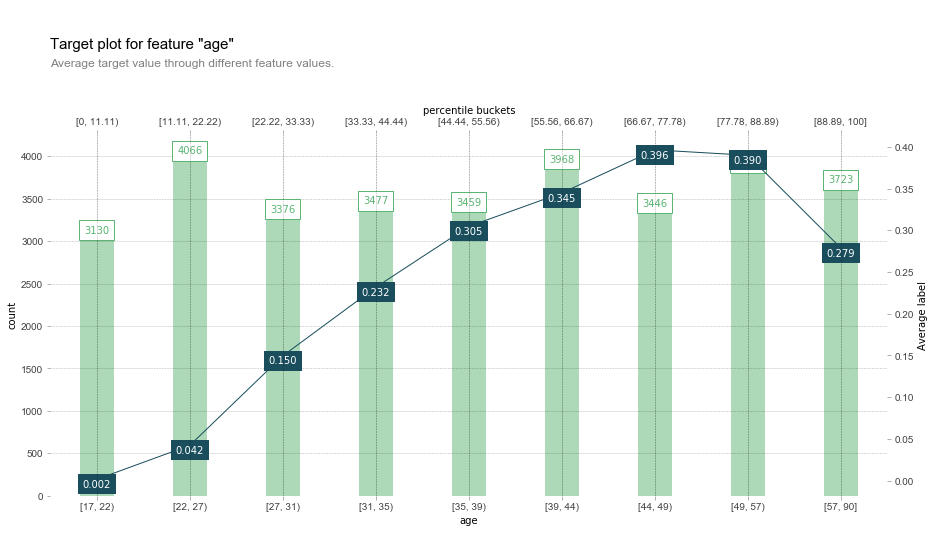 从图中发现,随着年龄的上升,收入大于50k的概率越来越高,超过一定年龄后会下降,这和PDP得出的结果是对应的。
plots_list = interpreter.partial_dependence.plot_partial_dependence([('Age', 'Education-Num')], im_model, grid_range=(0,1), figsize=(12, 5),?????????????????????????????????????????????????????????????????grid_resolution=100)
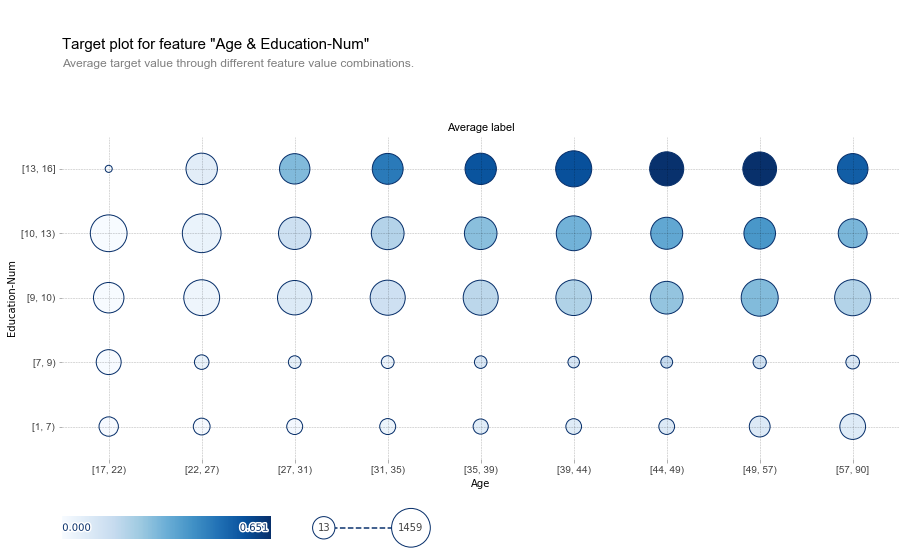
fig, axes, summary_df = info_plots.target_plot_interact(df=data, features=['Age', 'Education-Num'], feature_names=['Age', 'Education-Num'], target='label')
2.3 ICE(Individual Conditional Expectation)


2.4 LIME
可解释性:?对模型和特征两个方面都有要求。决策树、线性回归和朴素贝叶斯都是具有可解释的模型,前提是特征也要容易解释才行。否则像是词嵌入(Word Embedding)的方式,即使是简单的线性回归也无法做到可解释性。而且解释性还要取决于目标群体,比如向不了解模型的业务人员去解释这些模型。相比之下,线性模型也要比简单的贝叶斯更容易理解。 局部忠诚( local fidelity):既然我们已经使用了可解释的模型与特征,就不可能期望简单的可解释模型在效果上等同于复杂模型(比如原始CNN分类器)。所以解释器不需要在全局上达到复杂模型的效果,但至少在局部上效果要很接近,而此处的局部代表我们想观察的那个样本的周围。 与模型无关:?任何其他模型,像是SVM或神经网络,该解释器都可以工作。 全局视角:?准确度,AUC等有时并不是一个很好的指标,我们需要去解释模型。解释器的工作在于提供对样本的解释,来帮助人们对模型产生信任。
2.4.1 可解释性和性能的平衡
:分类器(复杂模型) :可解释模型(简单模型,eg.LR) :可解释模型集合 :可解释模型的复杂度度量 :特征 :目标函数 :相似度度量函数 :损失函数
2.4.2 LIME分析步骤
对整个数据进行训练,模型可以是Lightgbm,XGBoost等; 选择一个样例,进行可解释的N次扰动,生成局部样本; 定义一个相似度度量的函数,选取最能描述复杂模型输出结果的K个特征, 使用复杂模型对和进行预测; 对采样后的样本,拟合一个简单的模型,比如Lasso Regression得到模型的权重。
2.4.3 优缺点
表格型数据、文本和图片均适用; 解释对人友好,容易明白; 给出一个忠诚性度量,判断可解释模型是否可靠; LIME可以使用原模型所用不到的一些特征数据,比如文本中一个词是否出现。
表格型数据中,相邻点很难定义,需要尝试不同的kernel来看LIME给出的可解释是否合理; 扰动时,样本服从高斯分布,忽视了特征之间的相关性; 稳定性不够好,重复同样的操作,扰动生成的样本不同,给出的解释可能会差别很大。
2.4.4 实例
选择一个样本,重要性最高的5个特征,进行可解释分析:
np.random.seed(1)i = 16explainer = lime.lime_tabular.LimeTabularExplainer(train,feature_names = feature_names,class_names=class_names,categorical_features=categorical_features,categorical_names=categorical_names, kernel_width=3)exp = explainer.explain_instance(test[i], predict_fn, num_features=5)exp.show_in_notebook(show_all=False)

i = 10exp = explainer.explain_instance(test[i], predict_fn, num_features=5)exp.show_in_notebook(show_all=True)

2.5 SHAP(SHapley Additive exPlanation)
2.5.1 shapley值
有效性(Efficiency):所有价值均被分配 对称性(Symmetry):假设x_i和x_j可以互相替代,那他们收益应该一样; Dummy:?未做贡献的话收益为0; 可加性(Additivity):如果同一批人完成两项任务,那么两项任务的收益一起分配应该和分开分配的结果一致。

:特征的子集 :样本特征值 :针对集合S特征值的预测 :总的特征数
:特征不变,其他特征被随机数据点替换,得到的预测结果 :和上述类似,特征同样被替换 M:迭代M次
从训练数据中随机采样,样本
假设样本待预测样本为
将样本x中的特征随机替换为z中的特征,得到两个新的向量:
计算每次的边际收益
2.5.2 优缺点
SHAP值的计算是公平分配到不同的特征的,而LIME是选择一部分特征进行解释; 可以进行对比分析,同一个特征在不同样本之间的SHAP值进行比较,但是LIME不能; 具有坚实的理论基础,LIME使用LR等简单模型进行拟合,但是并不清楚为什么这样是work的。
计算非常耗时,指数级别的复杂度 SHAP可能存在误导,他计算的并不是将这个特征去掉以后训练模型得到的结果 计算某个样本的SHAP值时,需要获取整个训练数据集 如果特征之间存在相关性,这种基于扰动的方法,可能会出现不切实际的数据。
2.5.3 实例
# explain the model's predictions using SHAP valuesexplainer = shap.TreeExplainer(gbtree)shap_values = explainer.shap_values(test)# 对一个样本求shap值,各个特征对output所带来的变化shap.force_plot(explainer.expected_value, shap_values[16,:], test.iloc[16,:])

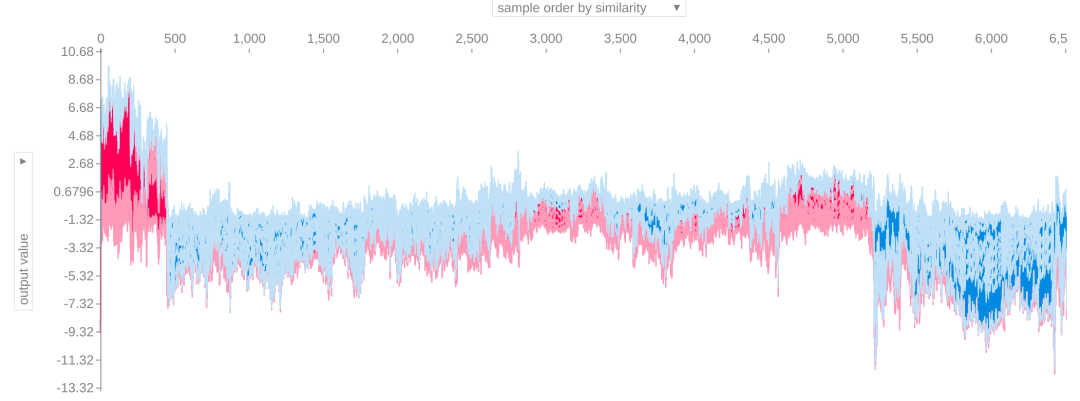
base value:全体样本Shap平均值 output value:当前样本的Shap输出值 正向作用特征:Education-num, Relationship, Age 反向作用的特征:Country, Capital Gain
shap.force_plot(explainer.expected_value, shap_values[10,:], test.iloc[10,:])

shap.force_plot(explainer.expected_value, shap_values, test)
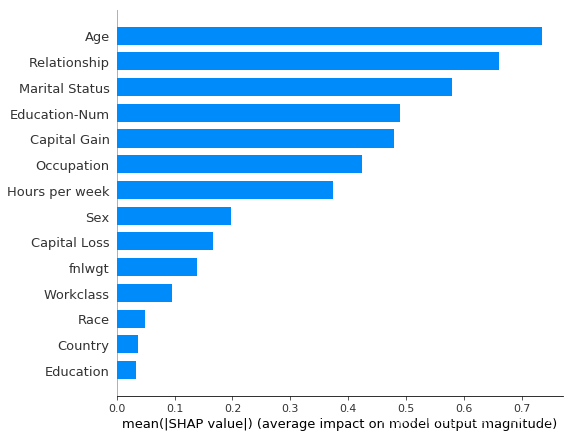
shap.summary_plot(shap_values, test)
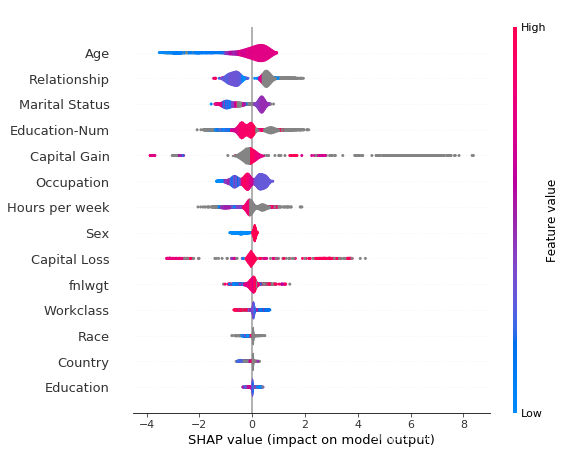
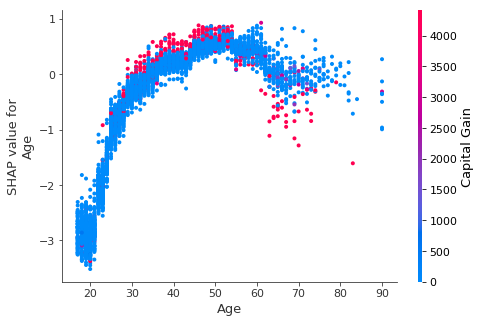
横坐标是SHAP值(对模型输出的影响) 纵坐标是不同的特征 颜色越红,特征值越大,越蓝特征值越小
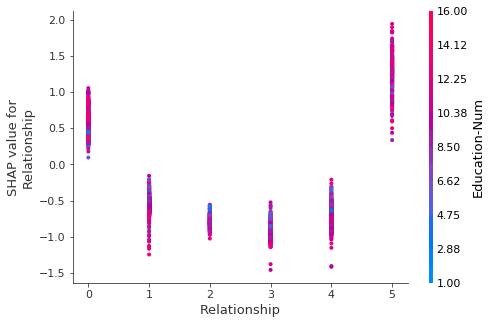
三、其他方法
3.1 Interpret
| heart-disease(303,13) | breast-cancer(569,30) | adult-data(32561,19) | credit-fraud(284807,30) | |
3.2 非事实解释(Counterfactual Explanations)
讲一个有意思的场景。假设我想去贷款,然后被银行的机器学习模型拒绝了。我会想,为什么我会被拒绝,以及如何能提高我被接受的概率。机器学习模型用到的特征包括,我自身的属性,包括收入、银行卡数量、年龄等。如何对这些特征做出最小的改变,使得模型的预测从拒绝变成接受呢?通过构建违反常规的样本,来改变模型的预测,从而达到对模型进行可解释的目的。
尽可能和想要的预测更接近; 对于特征值进行尽可能少的改变; 修改后的特征值尽可能符合实际情况。
[2]?可解释的机器学习:?
[3]?Kaggle课程-Machine Learning Explainability:?
[4]?机器学习模型可解释性的详尽介绍:?
[5]?A Brief History of Machine Learning Models Explainability:?
[6]?Shapley, LIME and SHAP:?
[7]?Interpreting machine learning models:
[8]?What If... you could inspect a machine learning model, with minimal coding required?:?
[9]?Papers on Explainable Artificial Intelligence:?
[10]?Limitations of Interpretable Machine Learning Methods:?
[11]?Comparison between SHAP (Shapley Additive Explanation) and LIME (Local Interpretable Model-Agnostic Explanations):?
[12]?One Feature Attribution Method to (Supposedly) Rule Them All:?
[13]?Introduction to AI Explanations for AI Platform:?
[14]?Hands-on Machine Learning Model Interpretation:?
[16]?Goldstein, A., Kapelner, A., Bleich, J., and Pitkin, E., Peeking Inside the Black Box: Visualizing Statistical Learning With Plots of Individual Conditional Expectation. (2015) Journal of Computational and Graphical Statistics, 24(1): 44-65:?
[17]?Lundberg S M, Erion G G, Lee S I. Consistent individualized feature attribution for tree ensembles[J]. arXiv preprint arXiv:1802.03888, 2018.:?
[18]?Ribeiro M T, Singh S, Guestrin C. Why should i trust you?: Explaining the predictions of any classifier[C]//Proceedings of the 22nd ACM SIGKDD international conference on knowledge discovery and data mining. ACM, 2016: 1135-1144.:
[19]??Lundberg S M, Lee S I. A unified approach to interpreting model predictions[C]//Advances in Neural Information Processing Systems. 2017: 4765-4774.:?
[20]?Nori H, Jenkins S, Koch P, et al. InterpretML: A Unified Framework for Machine Learning Interpretability[J]. arXiv preprint arXiv:1909.09223, 2019.:?
[23]?pdpbox:?
[24]?shap:?
[25]?lime:?
[26]?interpret:?
[27]?skater:?
END
转自:?数据派THU 公众号;
版权声明:本号内容部分来自互联网,转载请注明原文链接和作者,如有侵权或出处有误请和我们联系。
合作请加QQ:365242293??
数据分析(ID?:?ecshujufenxi?)互联网科技与数据圈自己的微信,也是WeMedia自媒体联盟成员之一,WeMedia联盟覆盖5000万人群。
关注公众号:拾黑(shiheibook)了解更多
[广告]赞助链接:
四季很好,只要有你,文娱排行榜:https://www.yaopaiming.com/
让资讯触达的更精准有趣:https://www.0xu.cn/
 关注网络尖刀微信公众号
随时掌握互联网精彩
- 1 总书记带领我们“办好自己的事” 7904833
- 2 再次提醒:中国公民近期避免前往日本 7808504
- 3 联合国厕所不再提供擦手纸 7712984
- 4 近15万亿新增贷款去哪了 7617862
- 5 华为重夺中国手机市场份额第一 7519663
- 6 蜜雪冰城开始卖早餐了 7425860
- 7 网警:男子AI生成车展低俗视频被拘 7332857
- 8 东北阿姨1984年买的黄金一克47元 7231378
- 9 刘强东砸35亿港元在香港买楼 7136287
- 10 立冬以来最大规模雨雪上线 7042862


 数据分析
数据分析


