
推荐 :使用Python进行机器学习的假设检验(附链接&代码)
作者:Jose Garcia?翻译:张睿毅?校对:张一豪
作者给出了假设检验的解读与Python实现的详细的假设检验中的主要操作。

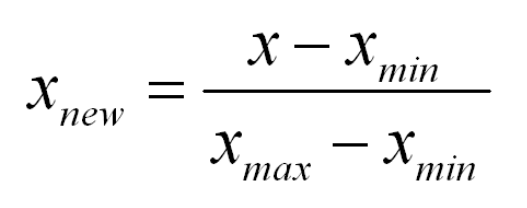
假设的基础是规范化和标准规范化
(链接https://en.wikipedia.org/wiki/Normalization_(statistics);https://stats.stackexchange.com/questions/10289/whats——the——difference——between——normalization——and——standardization)。我们所有的假设都围绕这两个术语的基础。让我们看看这些。

标准化的正态曲线图像和数据分布及每个部分的百分比
正态分布方程
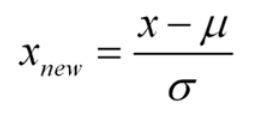
标准化正态分布
零假设:
?备择假设:

零假设与备择假设
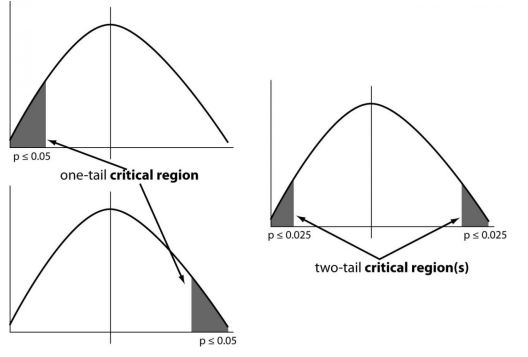
单尾和双尾图像
T校验(学生T校验)
Z校验
ANOVA校验
卡方检验
单样本t检验
双样本t检验
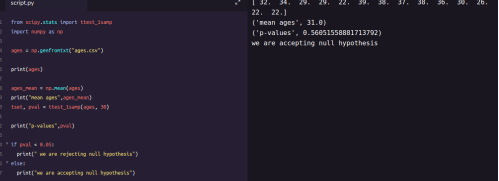
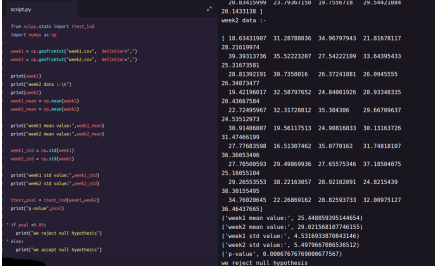
单样本t测试结果
from scipy.stats import ttest_indimport numpy as npweek1 = np.genfromtxt
("week1.csv", ?delimiter=",")
week2 = np.genfromtxt
("week2.csv", ?delimiter=",")print(week1)
print("week2 data :-n")print(week2)
week1_mean = np.mean(week1
)week2_mean = np.mean(week2)print
("week1 mean value:",week1_mean)print
("week2 mean value:",week2_mean)
week1_std = np.std(week1)week2_std =?
np.std(week2)print("week1 std value:",week1_std)
print("week2 std value:",week2_std)
ttest,pval = ttest_ind(week1,week2)print
("p-value",pval)if pval <0.05:??print
("we reject null hypothesis")else:??print("we accept null hypothesis”)
双样本t校验结果
import pandas as pd
from scipy import stats
df = pd.read_csv("blood_pressure.csv")
df[['bp_before','bp_after']].describe()
ttest,pval = stats.ttest_rel(df['bp_before'], df['bp_after'])
print(pval)
if pval<0.05:
????print("reject null hypothesis")
else:
????print("accept null hypothesis")
?
(链接:https://www.statisticshowto.datascie
ncecentral.com/
probability——and——statistics/hypothesis——testing/f——test/
; https://www.statisticshowto.datasciencecentral.
com/probability——and——statistics/chi——square/https://www.statisticshowto.
datasciencecentral.com/
probability——and——statistics/t——test/?)。
在下列情况下,您将使用Z测试:
您的样本量大于30。(链接:
https://www.statisticshowto.datasciencecentral.com/probability——and——statistics/find——sample——size/)否则,请使用t检验。
数据点应彼此独立。(链接:
https://www.statisticshowto.datasciencecentral.com/probability——and——statistics/dependent——events——independent/)换句话说,一个数据点不相关或不影响另一个数据点。
您的数据应该是正常分布的。但是,对于大样本量(超过30个),这并不总是重要的。
?您的数据应从人口中随机选择,每个项目都有相同的选择机会。
如果可能的话,样本量应该相等。
import pandas as pd
from scipy import statsfrom statsmodels.stats
?import weightstats as stestsztest ,pval = stests.ztest(df['bp_before'], x2=None, value=156)
print(float(pval))if pval<0.05:
????print("reject null hypothesis")
else:???
?print("accept null hypothesis")
ztest ,pval1 = stests.ztest(df['bp_before'],
x2=df['bp_after'],
value=0,alternative='two-sided')print(float(pval1))if pval<0.05:
????print("reject null hypothesis")else:????print("accept null hypothesis")
ANOVA(F-检验):t检验在处理两组时效果很好,但有时我们想要同时比较两组以上。例如,如果我们想根据种族等某些分类变量来测试选民年龄是否不同,我们必须比较每个级别的平均值或对变量进行分组。我们可以为每对组进行单独的t检验,但是当你进行多次检测时,你会增加误报的可能性。方差分析或ANOVA
(链接:https://en.wikipedia.org/
wiki/Analysis_of_variance)是一种统计推断测试,可让您同时比较多个组。

F校验或ANOVA实例图
df_anova = pd.read_csv('PlantGrowth.csv')
df_anova = df_anova[['weight','group']]grps = pd.unique(df_anova.group.values)
d_data = {grp:df_anova['weight'][df_anova.group == grp] for grp in grps}
?F, p = stats.f_oneway(d_data['ctrl'], d_data['trt1'], d_data['trt2'])
print("p-value for significance is: ", p)
if p<0.05:?
???print("reject null hypothesis")
else:??
??print("accept null hypothesis")
import statsmodels.api as sm
from statsmodels.formula.api import olsdf_anova2 =
?pd.read_csv
("https://raw.githubusercontent.com/Opensourcefordatascience/Data-sets/master/crop_yield.csv")
model = ols('Yield ~ C(Fert)*C(Water)'
, df_anova2).fit()print(f"Overall model F
({model.df_model: .0f},{model.df_resid: .0f}) = {model.fvalue: .3f}, p = {model.f_pvalue: .4f}")
res = sm.stats.anova_lm(model, typ= 2)res
(链接:https://stattrek.com/Help/
Glossary.aspx?Target=Categorical%20variable),将应用此测试。它用于确定两个变量之间是否存在显着关联。
df_chi = pd.read_csv('chi-test.csv')
contingency_table=pd.crosstab(df_chi["Gender"],df_chi["Shopping?"])
print('contingency_table :-n',contingency_table)
#Observed ValuesObserved_Values = contingency_table.values print
("Observed Values?:
n",Observed_Values)b=stats.chi2_contingency(contingency_table)
Expected_Values = b[3]print
("Expected Values :-n",Expected_Values)
no_of_rows=len(contingency_table.iloc[0:2,0])
no_of_columns=len(contingency_table.iloc[0,0:2])ddof=(no_of_rows-1)*(no_of_columns-1)print
("Degree of Freedom:-",ddof
)alpha = 0.05from scipy.stats import chi2chi_square=sum([(o-e)
**2./e for o,e in zip(Observed_Values,Expected_Values)])
chi_square_statistic=chi_square[0]+chi_square[1]print
("chi-square statistic:-",chi_square_statistic)
critical_value=chi2.ppf(q=1-alpha,df=ddof)print
('critical_value:',critical_value)
#p-valuep_value=1-chi2.cdf(x=chi_square_statistic,df=ddof)
print('p-value:',p_value)print('Significance level: ',alpha)
print('Degree of Freedom: ',ddof)
print('chi-square statistic:',chi_square_statistic)
print('critical_value:',critical_value)print('p-value:',p_value)
if chi_square_statistic>=critical_value:????print
("Reject H0,There is a relationship?
between 2 categorical variables")
else:????print("Retain H0,There is no relationship
?between 2 categorical variables")??
??if p_value< =alpha:????print
("Reject H0,There is a relationship?
between 2 categorical variables")else:????print
("Retain H0,There is no relationship between 2 categorical variables")
原文链接:
END
转自:数据派THU 公众号;?
课程推荐:
北京外国语大学今年正式开设
“商业数据分析”方向在职研究生
毕业后
可获国家承认双一流高校硕士文凭
数据分析粉丝专属福利,扫码免费听课?

关注公众号:拾黑(shiheibook)了解更多
[广告]赞助链接:
四季很好,只要有你,文娱排行榜:https://www.yaopaiming.com/
让资讯触达的更精准有趣:https://www.0xu.cn/


 数据分析
数据分析
 关注网络尖刀微信公众号
随时掌握互联网精彩


- 1 习近平将发表二〇二六年新年贺词 7904141
- 2 2026年国补政策来了 7808738
- 3 东部战区:开火!开火!全部命中! 7712893
- 4 2026年这些民生政策将惠及百姓 7616985
- 5 小学食堂米线过期2.5小时被罚5万 7519709
- 6 解放军喊话驱离台军 原声曝光 7428214
- 7 为博流量直播踩烈士陵墓?绝不姑息 7327605
- 8 每月最高800元!多地发放养老消费券 7238391
- 9 数字人民币升级 1月1日起将计付利息 7141831
- 10 2026年1月1日起 一批新规将施行 7040675